Real-Time Reporting & Data Visualization
Unlock the power of your data

You’ve got the data. Let us turn it into insights.
You’re tracking gifts, prospect meetings, and fundraiser performance metrics, but it can still feel like you’re operating without a clear view. Caritas Insights builds custom fundraising dashboards and advancement reporting tools that surface the metrics that matter most. With real-time access to actionable insights, your team can spend less time chasing down data and more time making informed, strategic decisions.
Our data visualization tools do more than just display information. They create alignment, improve accountability, and support data-driven decision-making across your advancement operation.
Good data drives fundraising success. But when it’s scattered, inconsistent, or difficult to interpret, it becomes a bottleneck, slowing teams down and burying insight beneath busywork. Too often, advancement staff spend their time producing reactive data that tells them things they likely already know. At Caritas Insights, we build reporting tools and dashboards that turn your data into a proactive force that powers strategic decision-making.
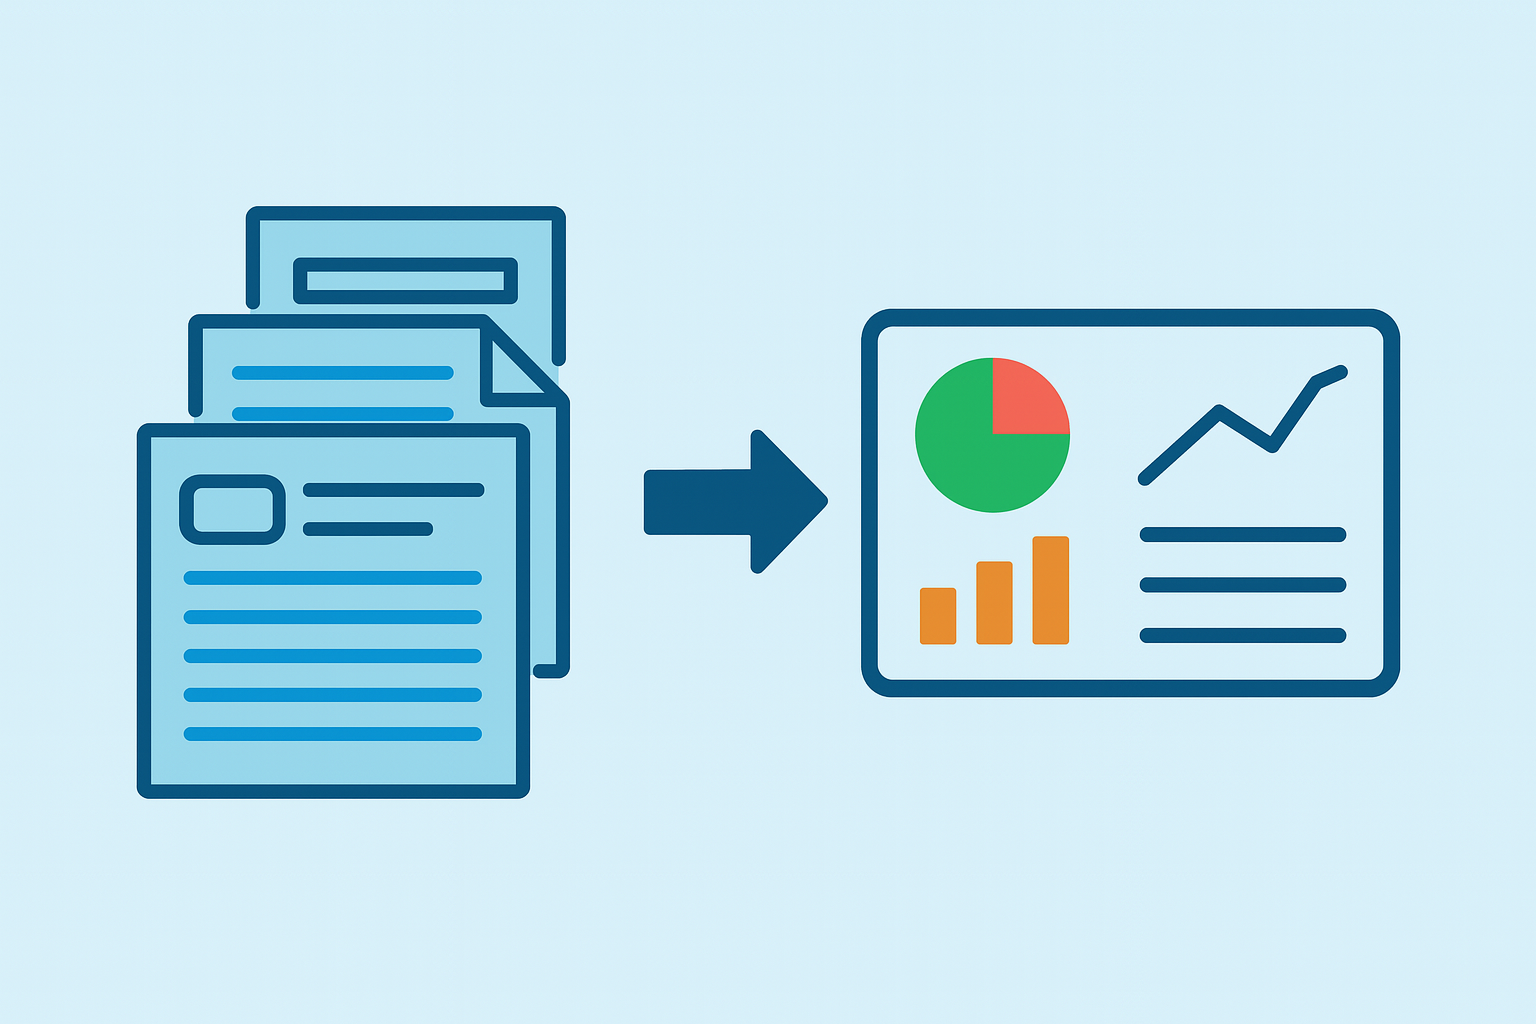
From Raw Data to Real Insight
A Purpose-Built Approach to Dashboards and Reporting
At Caritas Insights, we work closely with your advancement team to design reporting tools that support the way you operate, helping you streamline decision-making, reduce manual effort, and align around shared metrics.
Our dashboards are grounded in your real data, built to support your existing processes, and tailored to the unique goals of your institution.
We integrate seamlessly with your existing data infrastructure, CRM, and reporting tools. When we identify gaps or inefficiencies, we can provide targeted recommendations to optimize your stack, not overhaul it.
We Can Help You:
Audit your existing reports, identify duplication or conflict, and streamline toward a single “Golden Source” of truth, saving time and boosting confidence
Generate interactive maps to visualize constituent density and ensure optimal assignment and development officer travel planning
Build KPI dashboards to surface the metrics that are important to you and your team
Track progress toward campaign goals, visualize pipeline health, and model giving scenarios with dynamic tools you can actually use
Contact us
Interested in working together? Fill out some info and we will be in touch shortly. We can’t wait to hear from you!